
A 4-minute mini-documentary that traces the historical, demographic, cartographic and political evolution of Israel and Palestine across 140 years of history and 17 key milestones. Through dynamic maps and animated infographics, the project condenses a century and a half of tensions into a fluid and rigorous visual narrative.
Minidocumental de 4 minutos que recorre la evolución histórica, demográfica, cartográfica y política de Israel y Palestina, a lo largo de 140 años de historia y 17 hitos clave. A través de mapas dinámicos e infografías animadas, el proyecto condensa un siglo y medio de tensiones en una narrativa visual fluida y rigurosa.
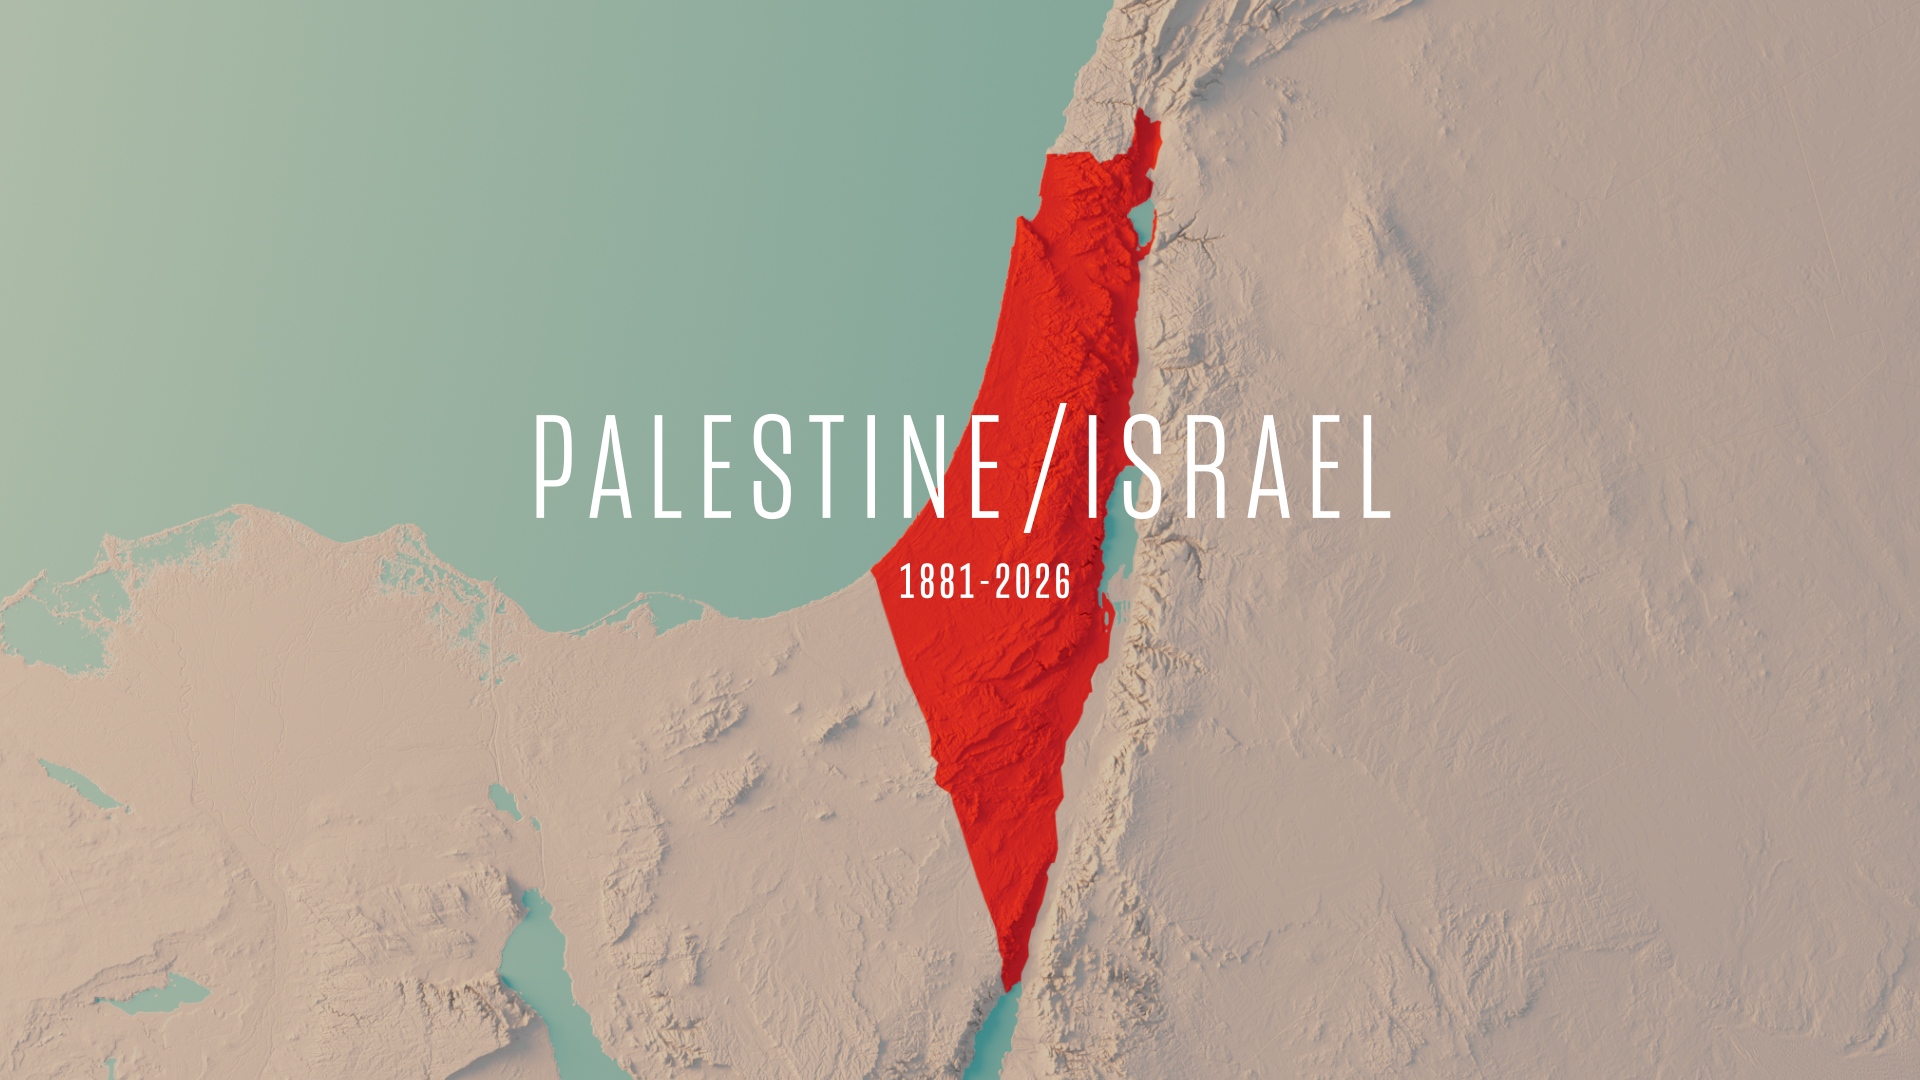
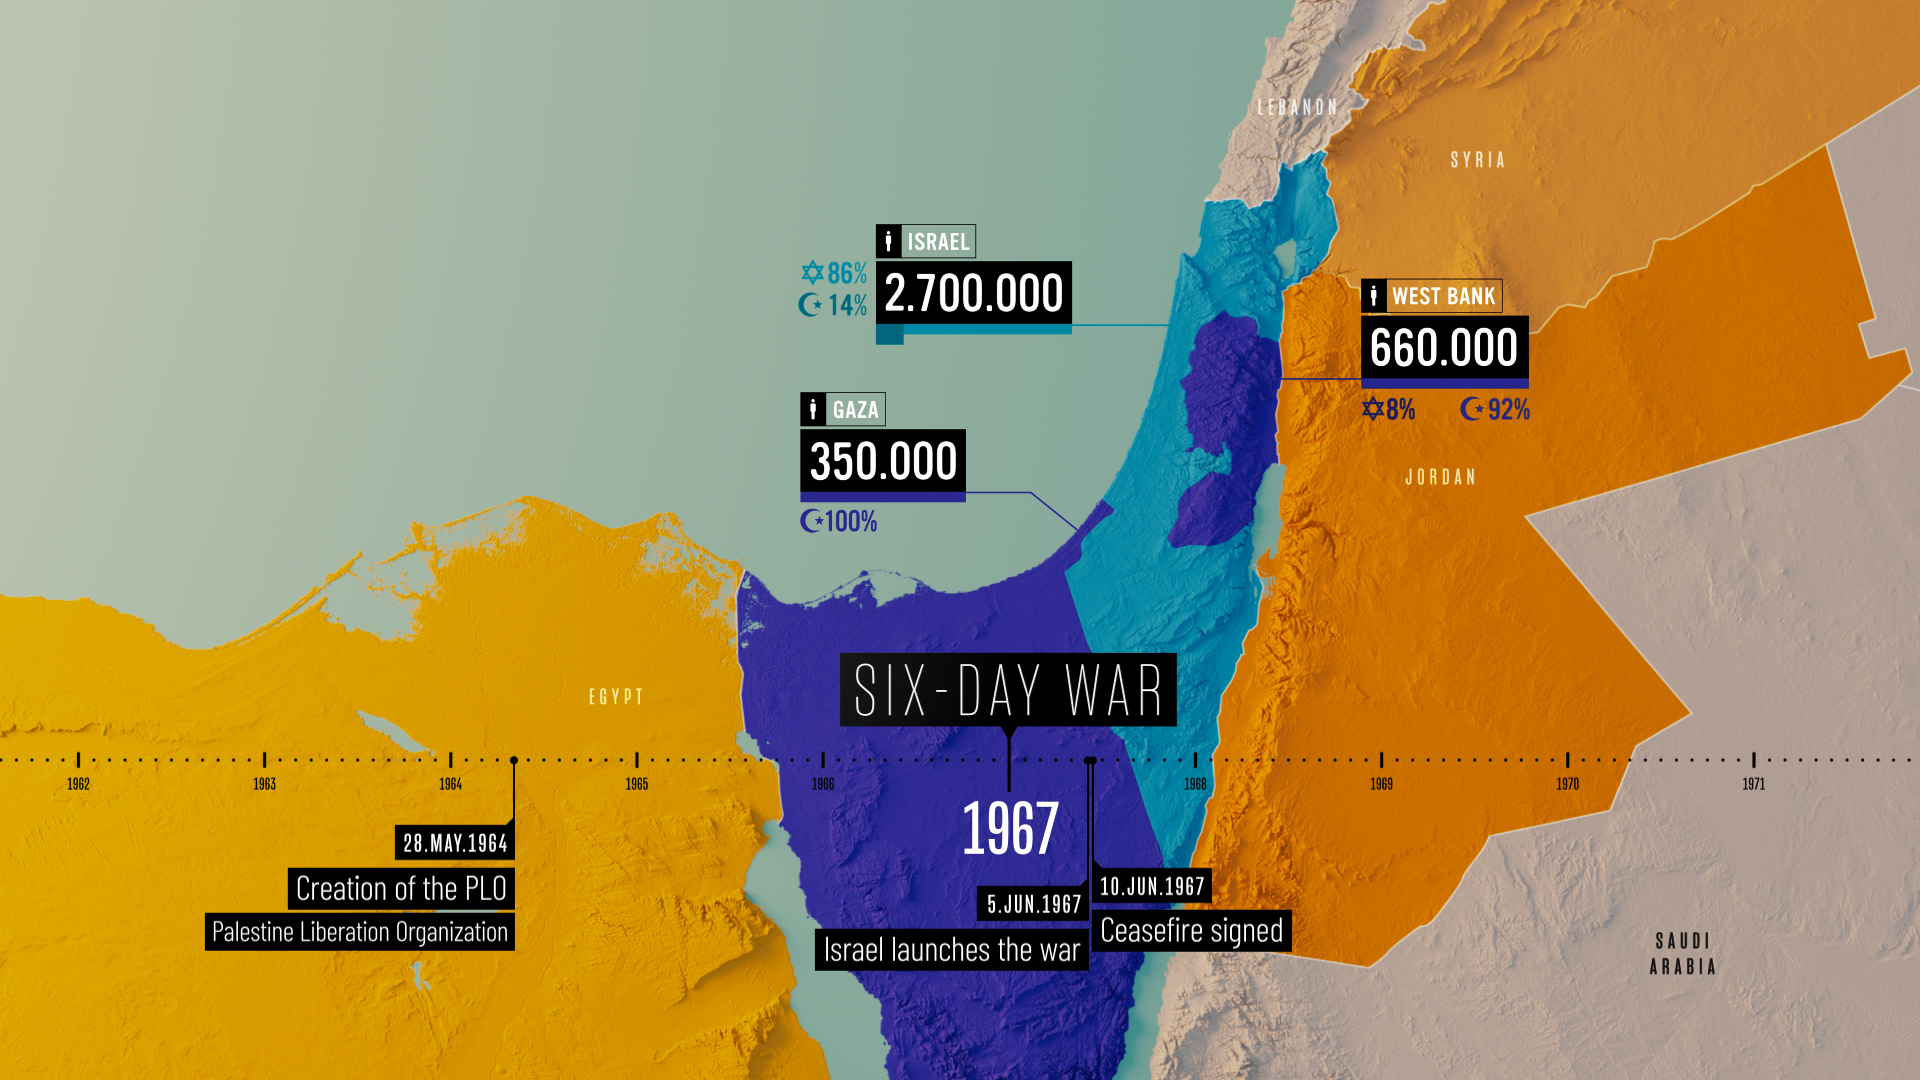

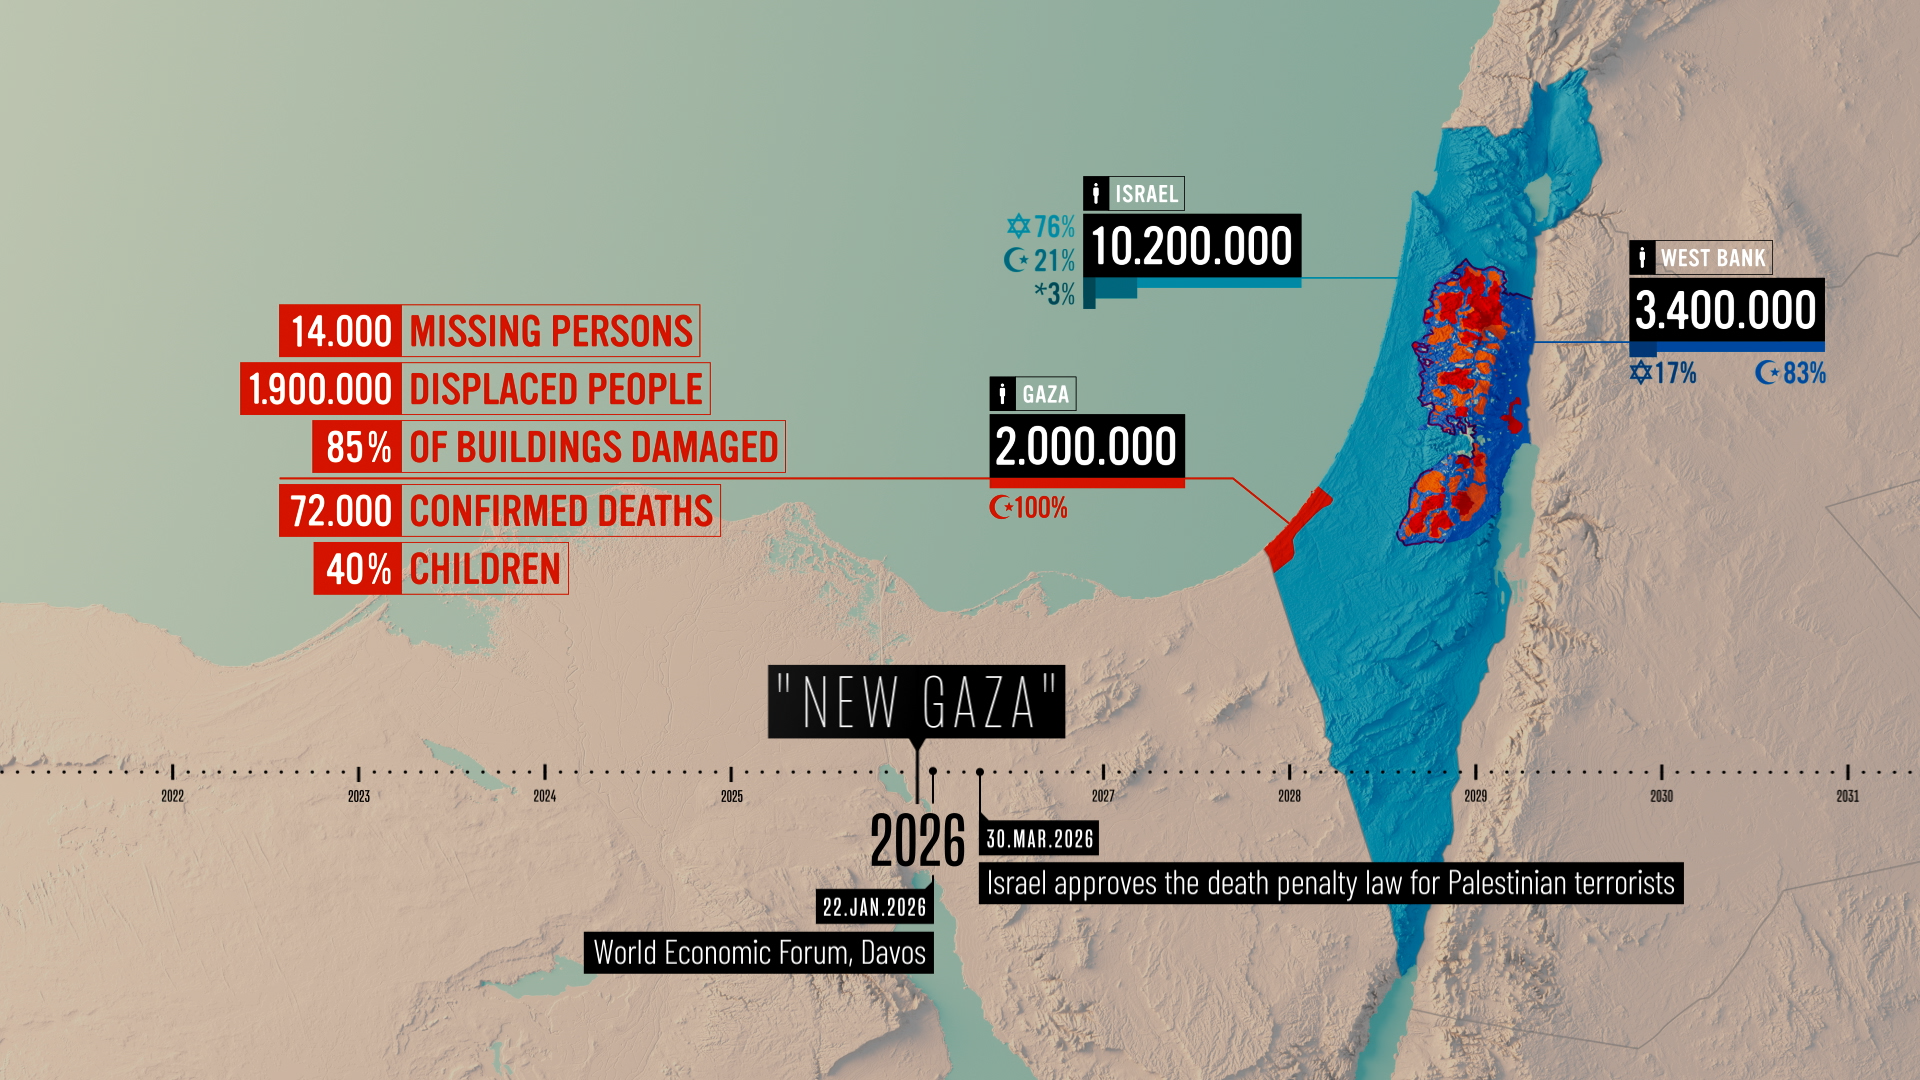
This is a personal project born out of the need to better understand the history of Israel and Palestine—a region in conflict for many decades, or centuries, which I have chosen to frame from the birth of Zionism in the late 19th century, in an Ottoman Palestine, up to the present day, mid-2026, with the war waged by Israel and the U.S. against Iran and Israel's invasion of southern Lebanon.
Este es un proyecto personal que nace de la necesidad de conocer mejor la historia de Israel y Palestina. La de una zona en conflicto desde hace muchas décadas, o siglos, y que yo he decidido acotar desde el nacimiento del sionismo, a finales del siglo XIX, y en una Palestina otomana, hasta la actualidad, mitad de 2026, con la guerra de Israel y EEUU contra Irán y la invasión del sur del Líbano por parte de Israel.
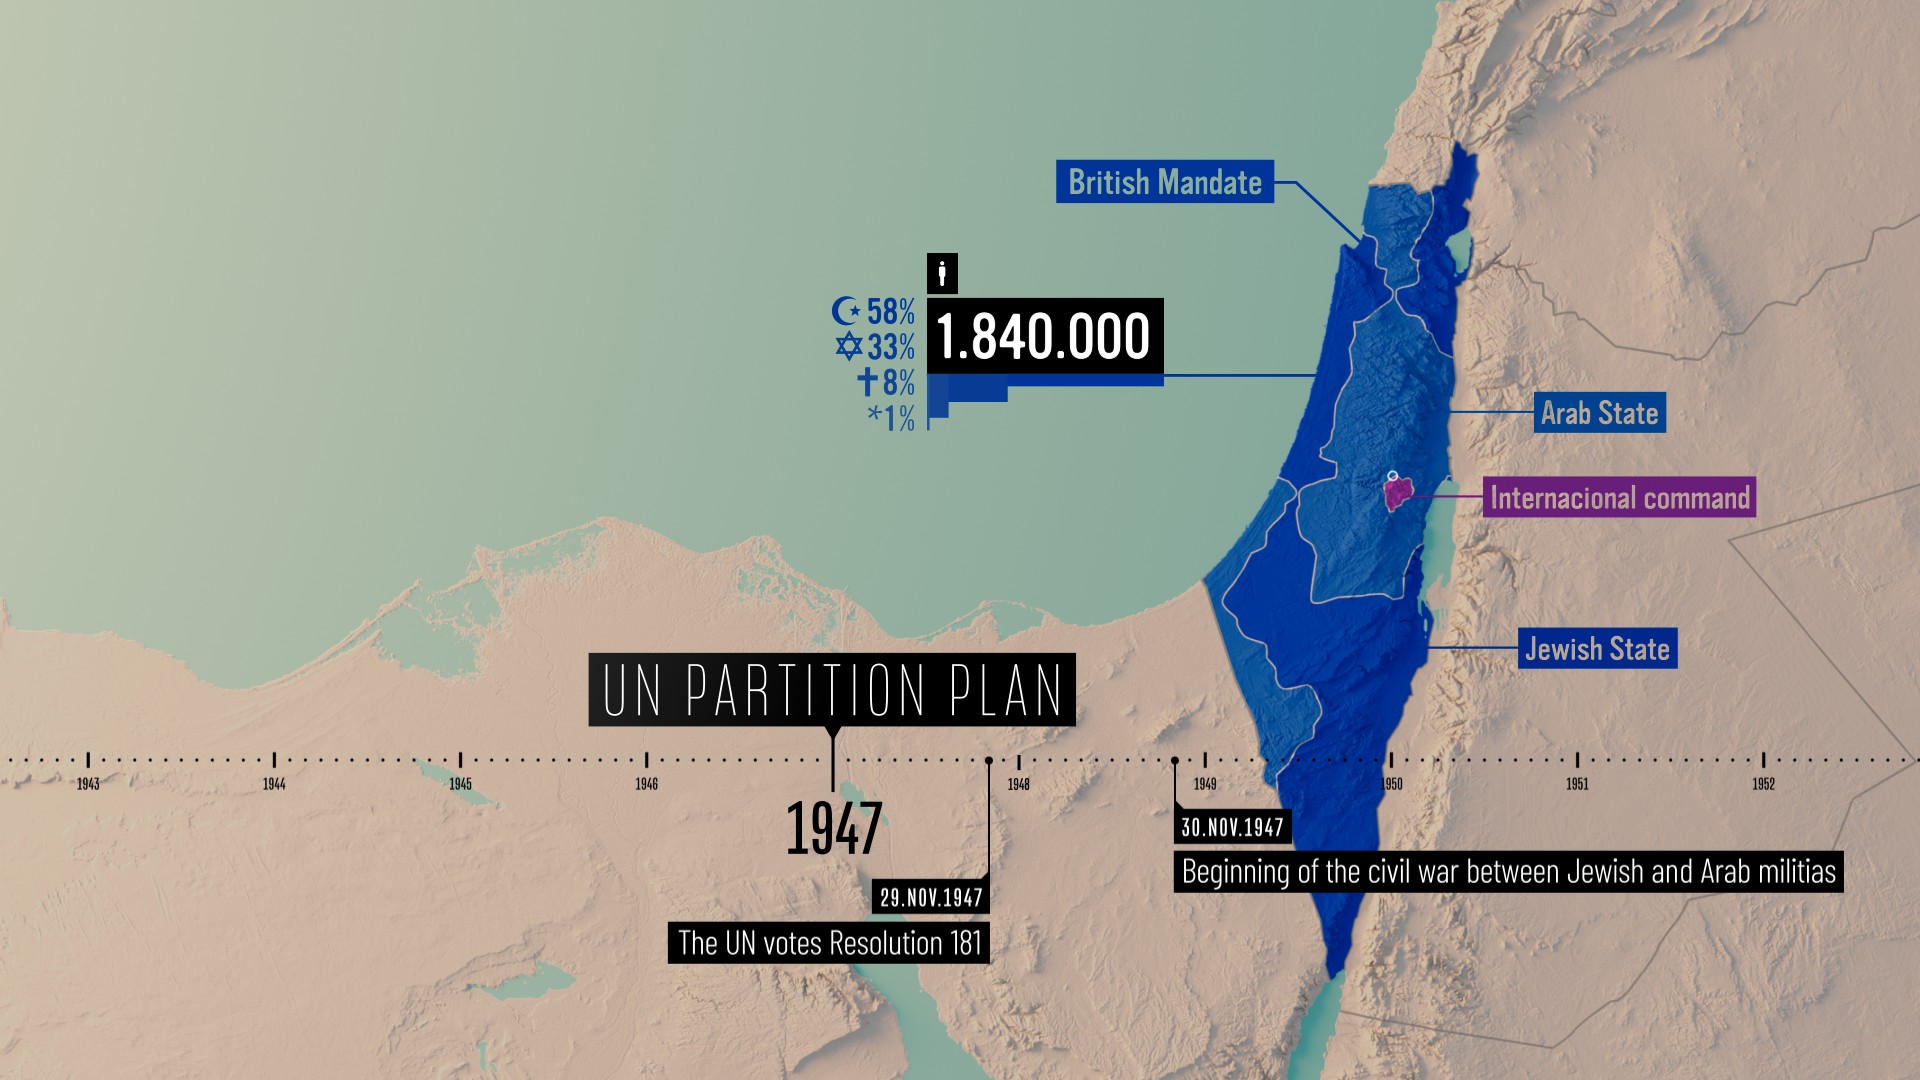
The project also served as a testing ground for working with AI. Both ChatGPT and Gemini acted as analytical assistants for gathering and cross-checking data, allowing me to obtain and verify all the historical and demographic information. This synergy streamlined a process that would traditionally have been very time-consuming, especially regarding the demographic data, which in my opinion holds significant value and allows for a clearer picture of the conflict.
El proyecto también me sirvió como banco de pruebas con la IA. Tanto ChatGPT como Gemini funcionaron como asistente analítico para la recopilación y el contraste de datos, permitiéndome obtener y cotejar toda la información histórica y demográfica. Esta sinergia optimizó un proceso que tradicionalmente habría sido muy costoso en horas, sobre todo en lo referente a los datos demográficos y que, en mi opinión, tienen un valor significativo y permiten hacer una mejor radiografía del conflicto.
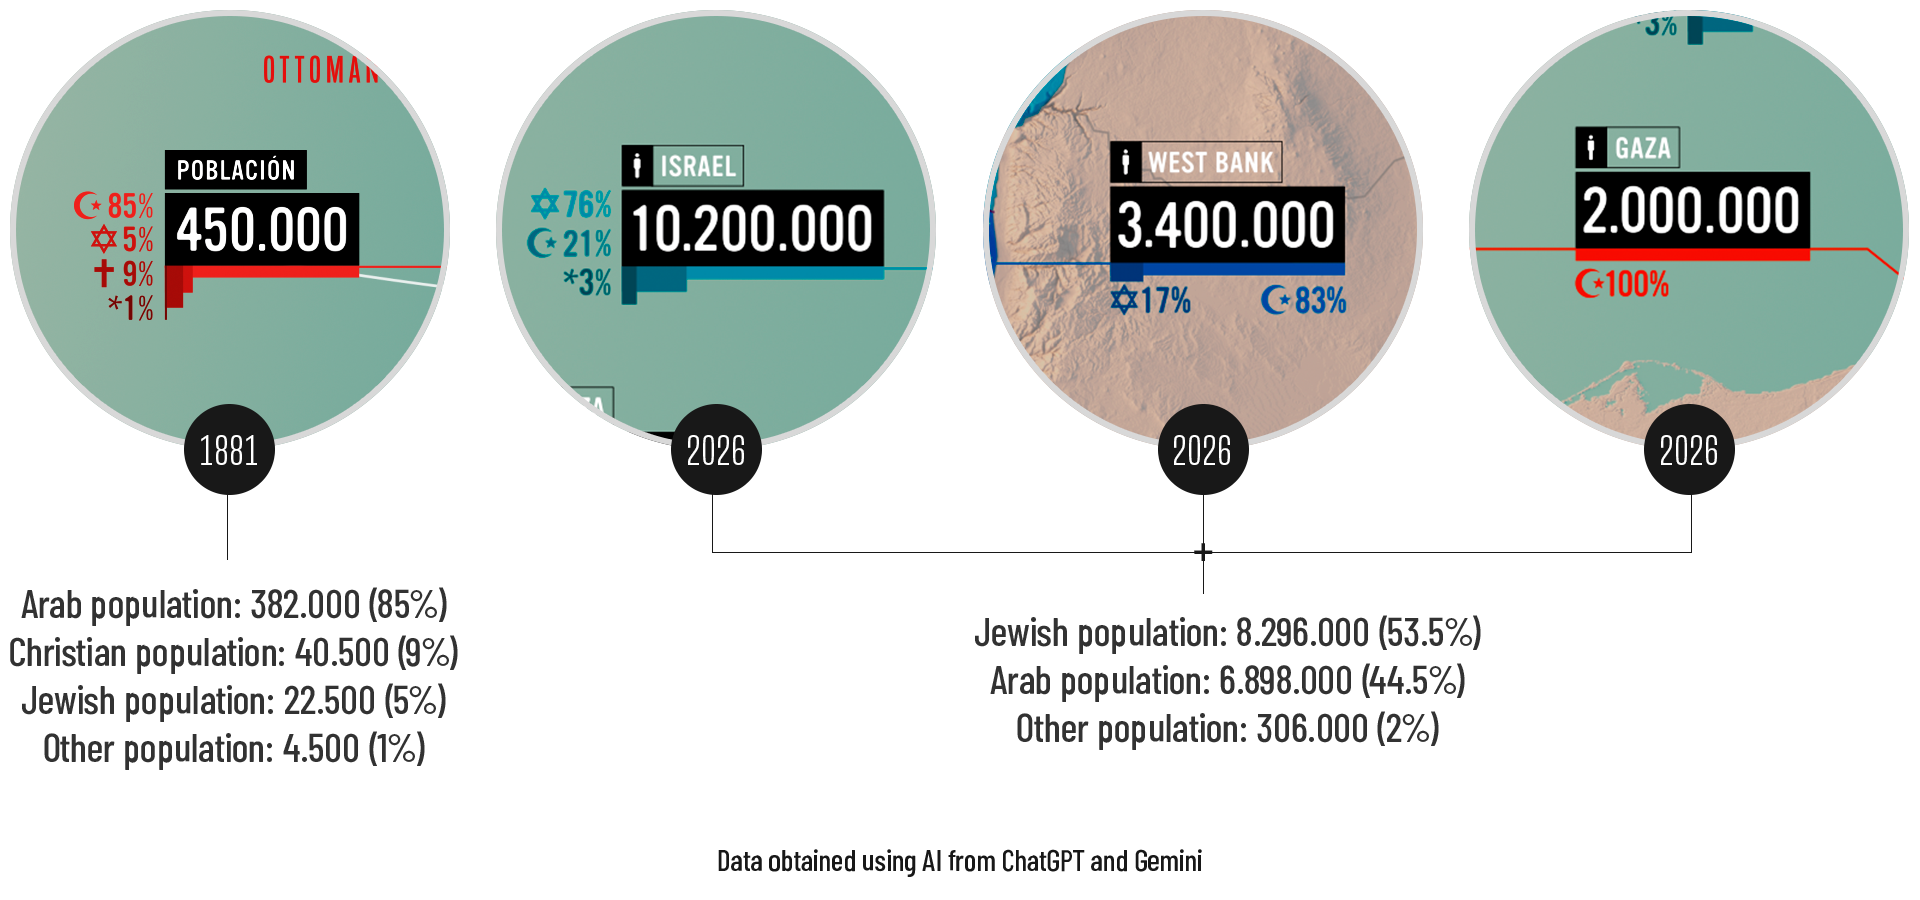
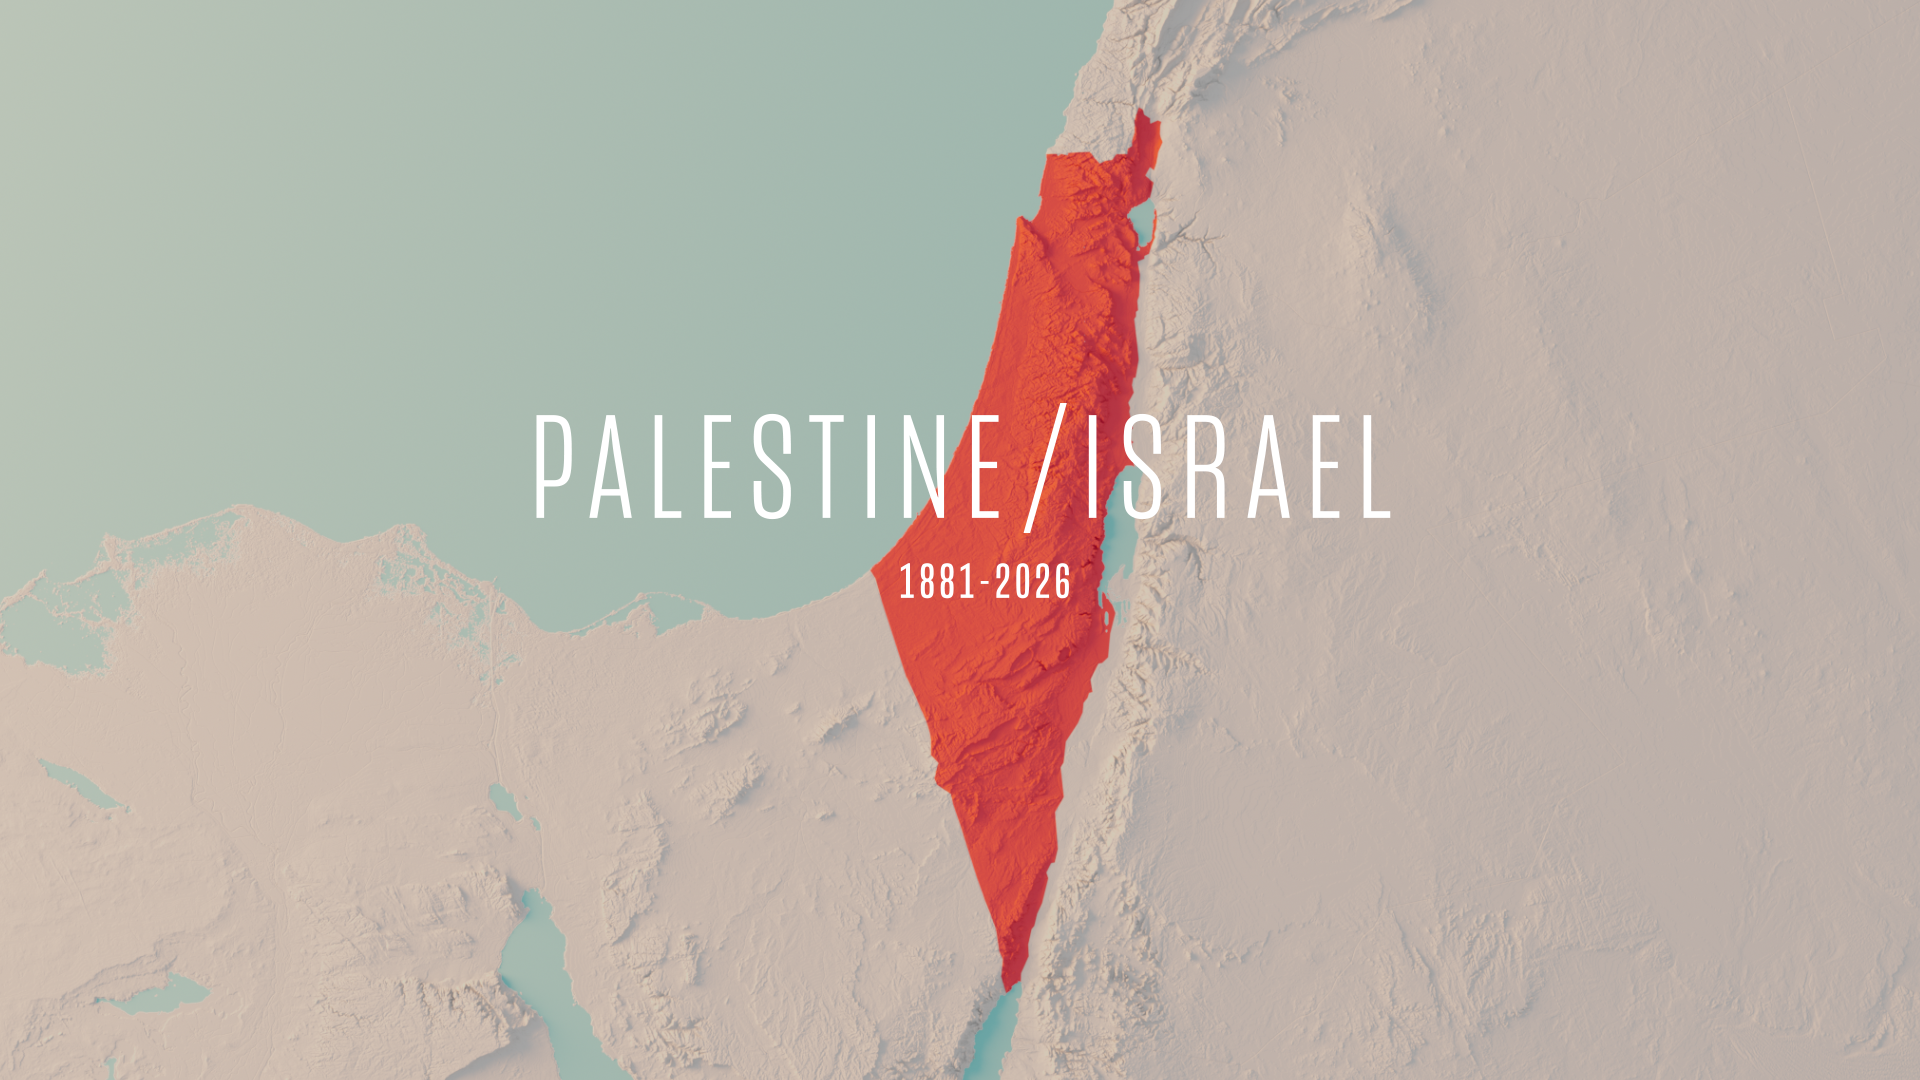
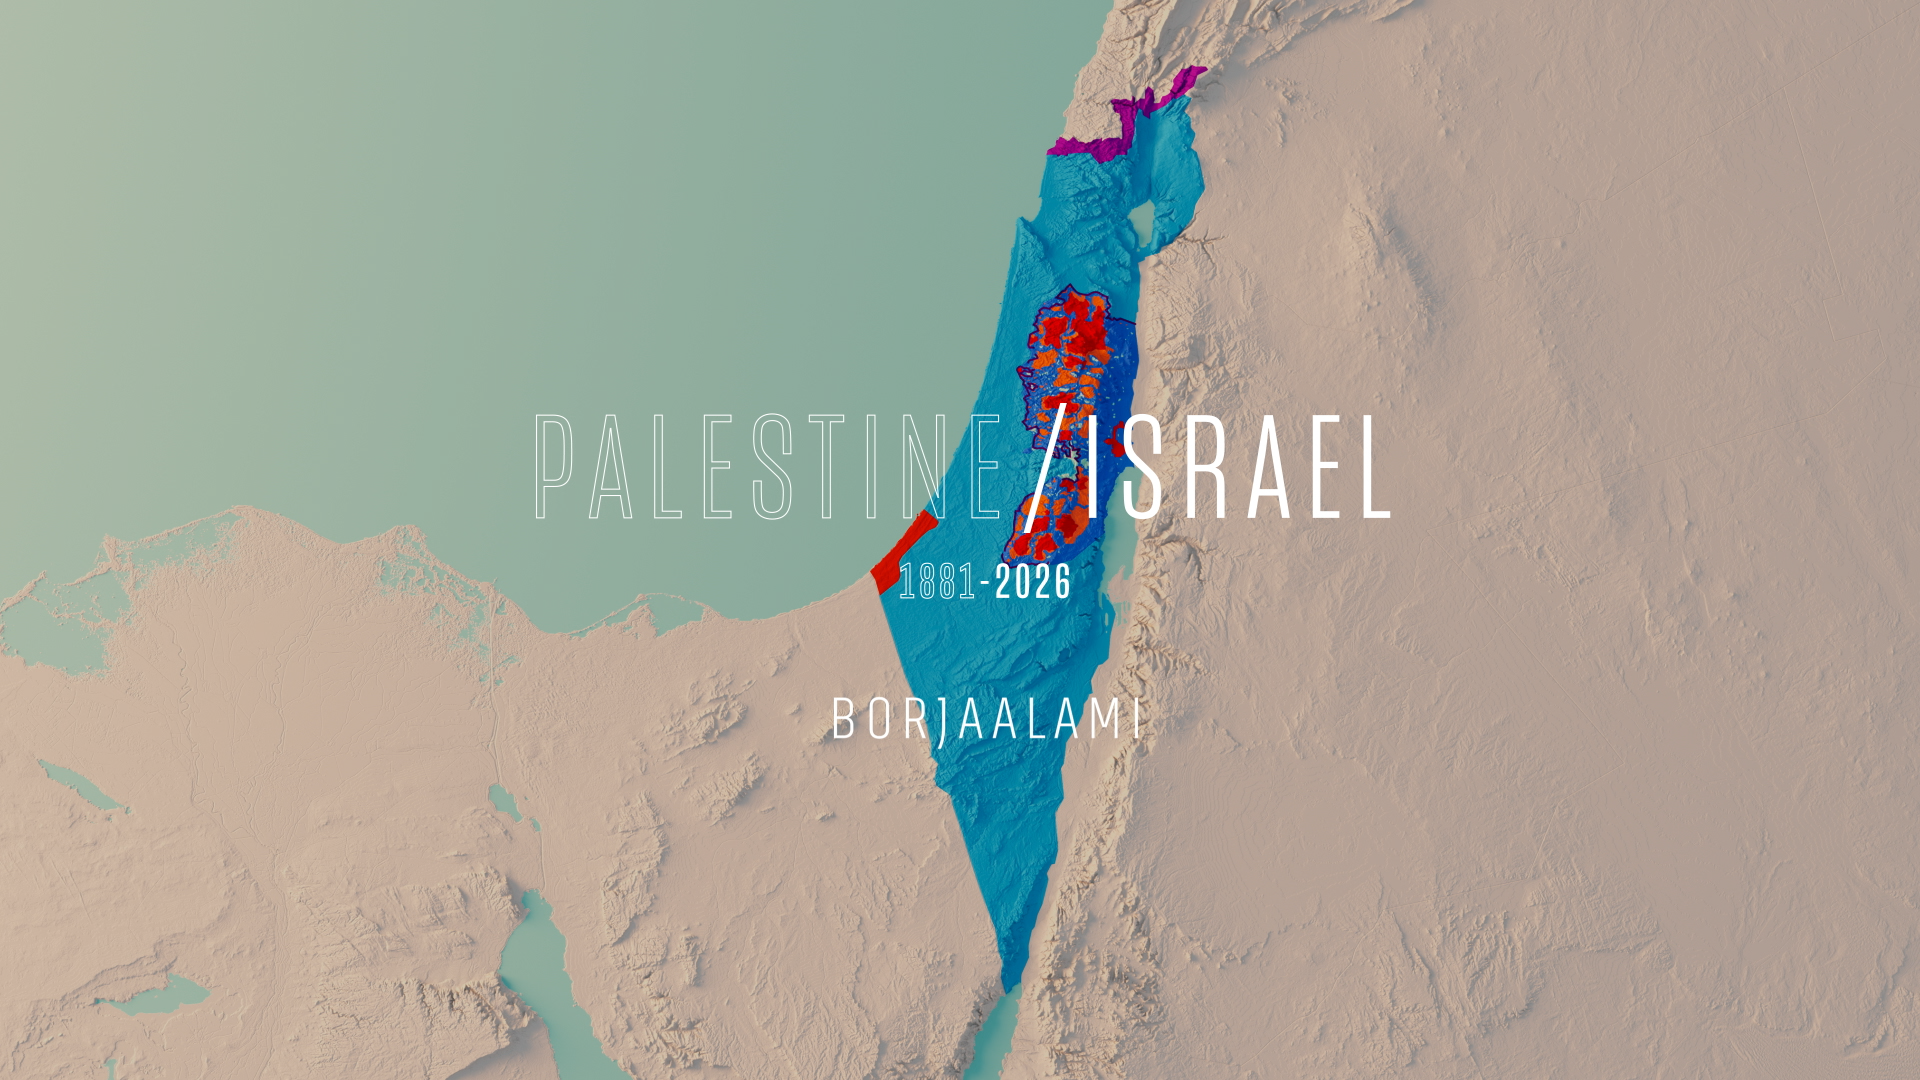
The maps, the foundation of the project, are generated in 3D to provide textures with volume. Using displacement maps obtained from Tangram Heightmapper, an open-source service, and applying animated vector textures over them, I was able to achieve an attractive visual result, giving the terrain an artificial realism.
Los mapas, la base del proyecto, están generados con 3D para proporcionar texturas con volumen. Mediante mapas de desplazamiento obtenidos a partir de Tangram Heightmapper, un servicio de Open Source, y aplicando sobre ellos texturas vectoriales animadas, lograba obtener un resultado visual atractivo, dotando al terreno de un realismo artificial.
English Version
Versión Española
Creative Direction: Borja Alami
Edit & Animation: Borja Alami
Documentation: ChatGPT, Gemini
Locution: ElevenLabs
Music: Premiumbeat
Displacement maps: Tangram Heightmapper
Other tools: Cinema 4D, After Effects, Illustrator, Photoshop